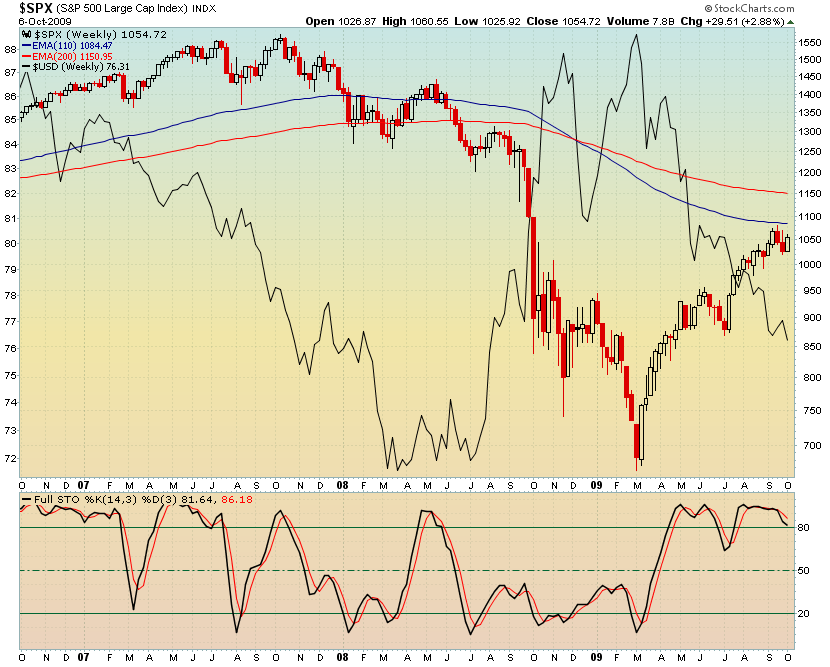
$SPX / $USD 3-Year Weekly Chart
One of those things that are useless for short-term trading but interesting to look at – the big picture.
$SPX is candles, U.S. dollar is the black line. Not always perfectly correlated, but clearly that’s the game for now.