This is the May 11th edition cover, The Economist. [[SPY]]
read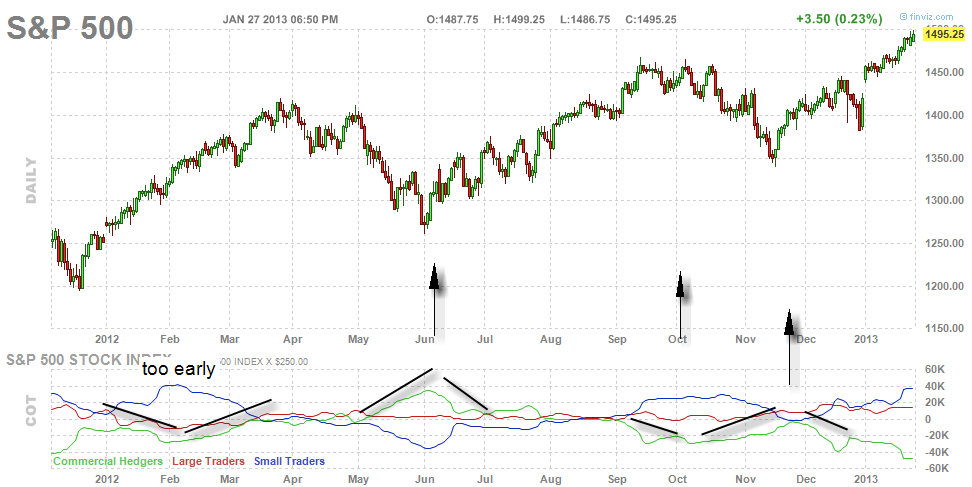
Small traders are wrong (long at peaks), Commercial hedgers are right (long at bottoms) – most of the time. There’s also a small matter of
readHere’s a 22 year chart of the VIX Volatility Index. I used VIX yesterday to make a decision about a short trade, but I have
readCanadian markets are closed: December 25th for Christmas Day December 26th for Boxing Day January 1st for New Year’s Day U.S. markets are closed: December
readIf I were short here, I’d be buying. Here’s a few random indicators (my favs of late) that paint the picture. Click images to enlarge
read[[SPY]] 20-year chart, 1-year bars. I was looking for a fitting pattern, and only the triple top seems right. I’m still mostly long the markets,
readLatest insider buy/sell stats, as of March 8th. In addition to this, there’s been some selling on strength of SPY, not super significant but around
readInsiders aren’t shopping much lately: Click to enlarge And for comparison, here’s the $SPX Chart for the same period
readS&P500 vs TSX Composite charts. Particularly interesting is the 5-year chart. There have to be some people who have been waiting for the last 4
read
Reposting from Duc’s blog. Source: Stock Trader’s Almanac, CPI data. Click to enlarge
readClick charts to enlarge $BKX, Bank Index This is in a very ugly territory. It hasn’t been this bad since the start of the 2008-09
readImmediately above is a weekly chart of the SP500 holder SPY with the daily dates most of the major lows and highs labelled. Click on
readView More