SPY October 31 Intraday Support Resistance
Here’s a demonstration of how well the pivot calculation worked today. Yesterday I posted a chart with these levels:
R1 – 96.28
S1 – 92.67
R2 – 98.20
S2 – 90.98
SPY never got to the lower levels. It started testing the first resistance right out of the gate. Once it broke above it, that level became support, and SPY bounced off of it at the end of the day.
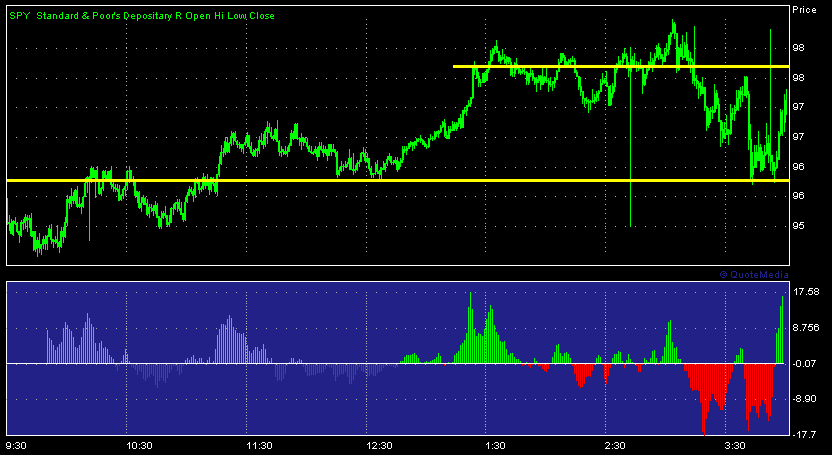
Click to enlarge
what a barbaric stop hunting!
What do you mean?
Kat,
The theory of stoplosses is so well known and documentated, market makers will periodically run the stops to generate volume and almost guarantee themselves a profit in the process.
It’s certainly a fact of life, although never categorically “proven” in the markets.
jog on
duc
Ahha I see 🙂 makes sense. I’ve heard that before, though never pay much attention because I don’t like using stops (except trailing).
And during the day I only try to snatch the middle part of the move.
Kat,
The trouble is, they fade them all day long. Difficult to discern a stop run, against a change in price action, unless it’s at the edge of some other measure, say a PP. [as you seem to use them]
jog on
duc
Just see 2 longest candlesticks between the SUP and the RES on your pic.
Those are “signals”, they show the direction of the next move (believe it or not). I use these spikes and tails, too. 99.9% reliable 🙂