$SPX, $VIX, XLF Charts
S&P 500 ($SPX)

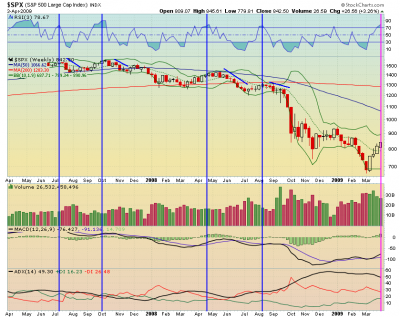
2-year weekly chart of S&P 500 index
Getting overbought, so we can probably expect some weakness in the next week or two. Vertical lines show previous times when weekly RSI(3) was in overbought territory and slanted lines show market softening as a result.
I think those will be buyable dips, unless the U.S. dollar strengthens.
$VIX

Daily chart of the Volatility Index
Broke down (but still sort of at support if you draw a horizontal line)
XLF

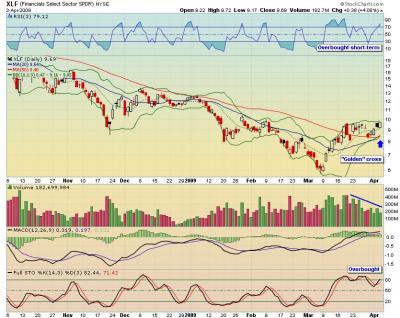
Financials ETF daily chart
While it’s overbought, the question is — do you want to mess with the government? Besides, the sector is coming out of a severely oversold condition (85% drop!)
Have a good weekend, you.
