Open to Interpretation
Ignoring all indicators, let’s just look at the possible ways to interpret the Dow Jones chart.
Click to enlarge
Scenario #1
Sideways channel, neutral until breaks up or down outside the channel range

Scenario #2
Inverted head-and-shoulders, bullish formation

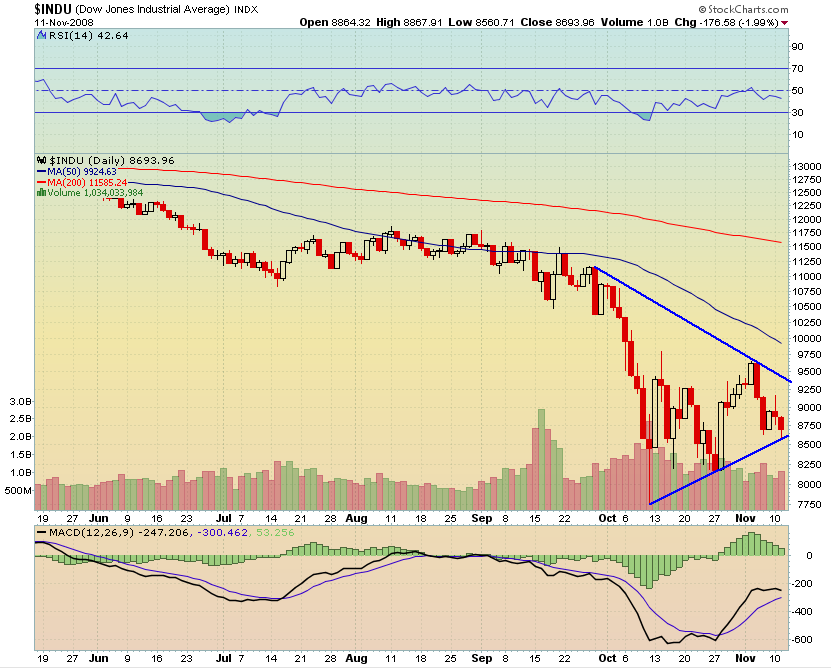
Scenario #3
Triangle/pennant, trend continuation pattern, in our case – bearish
Quick recap: the psychology behind this formation is that every time stocks go up a little, investors are eager to get out and sell at a price even lower than their cost just to get out (presumably they bought on the last top and seeing the drop want to sell ASAP). Therefore, each new top is lower than the previous one.
Not perfect, but still valid – especially if it’s confirmed 🙂
Thursday is the Full Moon, and it’s going to be very close to Earth (fairly rare, last time it happened in 2005). Increased gravitational pull can play tricks on our minds. Be careful.