Mystery Chart Revealed
I got 3 responses:
- “Looks like a chart of my brokerage account lately”
- “DJIA 1938-1939”
- “I think the chart is from 1929-1930”
Original image

DJIA, January 2002 to December 2002
2002!!!

2008 to Present
Ok, so it’s not a mirror image of the above. Present chart looks stretched in time. This was fun, but I’m disappointed that there’s not more resemblence. How easy would it be to use the old chart as a reference for trading! 🙂

DJIA, 1929-1930
I see vague similarities, especially at the start of the drop.

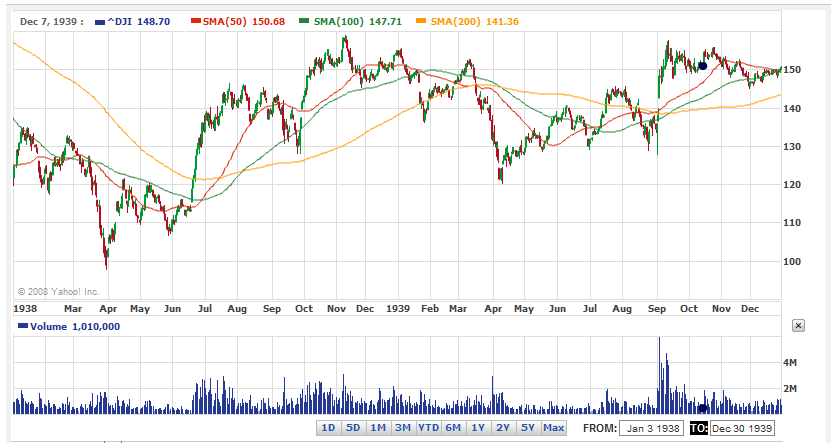
DJIA, 1938-1939
Wow, what a chopfest.
Kat,
Never realized you could grab those timeframes from Yahoo. Excellent resource.
jog on
duc
Kat,
Bugger…can’t get those early dates.
How did you do it?
jog on
duc
Duc,
it’s a bit glitchy.
You see the date boxes in the lower right?
You have to manually enter the dates in a numerical format in them: month/day/year
1/31/1929, for example
Then press Enter and check to make sure the date is correct
You may have to re-enter it twice
Then move on to the second box and do the same
Kat,
Ahhhh, ok, I’ll give it a try…ta!
jog on
duc
Kat,
Nope, can’t get it to work…might be my cookies issue.
jog on
duc
Maybe try a different browser, if you’ve got one?
Or upgrade your Flash plugin. These are Flash-based charts.