$GLD Gold ETF Daily Chart
[[gld]], SPDR Gold Trust ETF
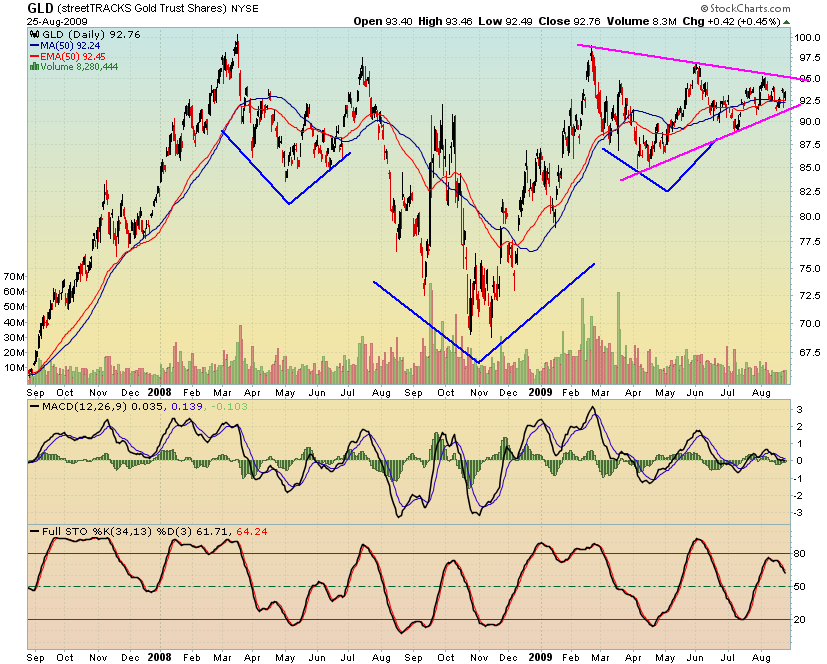
2-year daily chart of GLD, gold ETF.
- Inverse head and shoulders (bullish pattern)
- Also bullish is the symmetrical triangle, really looks a bit like an ascending triangle, which is a continuation pattern
Since these are fairly long-term patterns (not a month or two), I think they are more reliable.
Gold should break out soon.
Kat,
Assuming no change in policy from the Treasury, the fundamentals for gold are bullish. Thus we have confirmation of the bullish technicals.
I’ve given up my flip-flops in GLD, just holding long now.
jog on
duc
Hi Duc,
they’re trying hard to inflate but some are still calling for deflation. The jury is still out on that 🙂
I’m waiting for a break out of the triangle and watching the dollar.