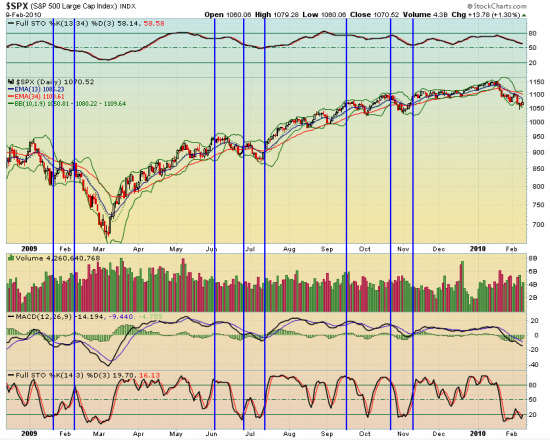
$$ 2009 Bradley Turn Dates
The Bradley siderograph was developed in the 1940’s by Donald Bradley to forecast the stock markets. Bradley assigned numerical values to certain planetary constellations for every day, and the sum is the siderograph. It was originally intended to predict the stock markets.
2009 turn dates were:
January 20-21
Feburary 8-9
June 3
June 26
July 14-15
September 14-15
October 22-23
November 9
The Bradley predicts turning points ONLY and not the polarity, i.e., a high in the chart may also be a low and vice versa.
Here’s how it played out in 2009. I’m using S&P 500:
If anything is obvious, it’s only in retrospect. I tracked the dates throughout the year and couldn’t figure out what they meant in ‘real-time’ – was it the top, is this the bottom? Will see if I can use them to predict anything in 2010.

