$$ The 21st of the Month
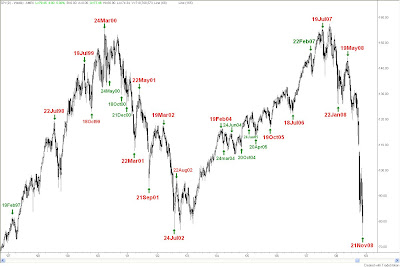
Immediately above is a weekly chart of the SP500 holder SPY with the daily dates most of the major lows and highs labelled. Click on it to zoom-in on this chart.
As you can see, it is not uncommon for a major low or high to fall between the 18th and 24th of the month with a focus on the 21st. Many believe this takes place due to the changing psychology of investors and traders as per the zodiac annual cycles every 21st of the month http://en.wikipedia.org/wiki/Zodiac.
In any case, whenever the market is making a major swing low or high into the time period of the 18th to 24th of the month, I am always on the look out for a big turn. Since the market began crashing following the May 19, 2008 top, there have been two instances where prices had the opportunity to make a major swing low into the 18th to 24th time period. These were Sep 18, 2008 and Oct 24, 2008 which resulted in 12% and 20% rallies respectively. I think this Friday Nov 21st low has a much better than even chance of producing a +25% rally.
Source:

