$SPY, $QQQQ Monthly and Weekly Charts
Click charts to enlarge
$QQQQ Monthly, 20ema
Just one Cubes chart, for comparison purposes only. The price is above 20ema on the monthly.

$SPY Monthly, 20ema
Hasn’t quite made it up there yet.
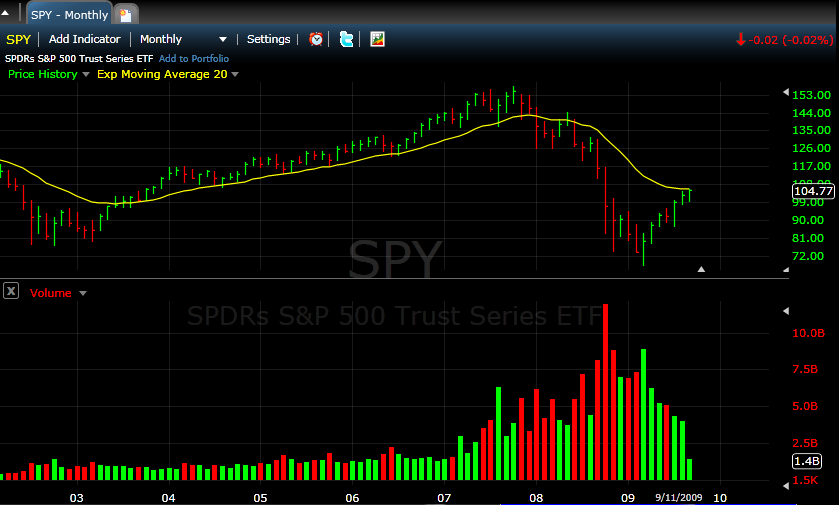
$SPY Monthly, 1993 to present, 20ema
To proclaim a new bull market with confidence, it’s pretty obvious the price has to make it over the 20ema on the monthly chart.

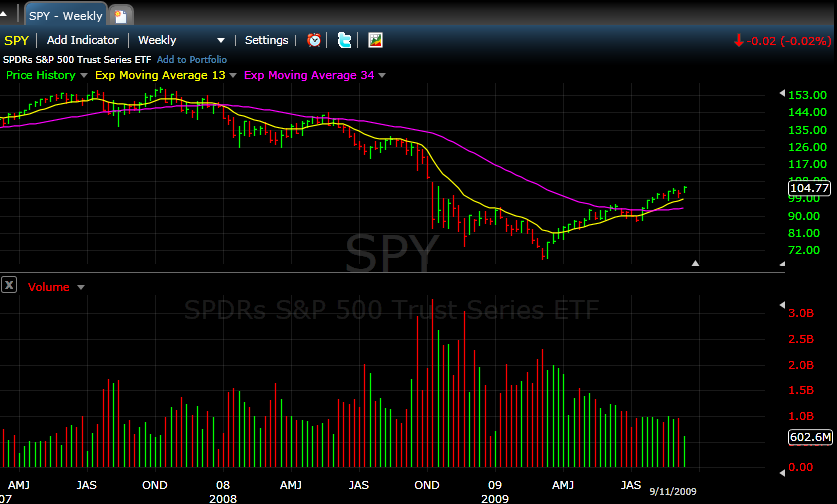
$SPY Monthly, 13/34ema
13/34ema cross would also be a confirmation of the turnaround.

$SPY Weekly, 13/34ema
13/34ema cross has already happened on the weekly, and both moving averages are pointing up.